Tuesday, 17 September 2013 11:06
CPI inflation falls to 2.7% in August says ONS
The ONS says that the Consumer Prices Index (CPI) fell to 2.7% in the year to August, down from 2.8% in July.
The main contributions to the decline came from the transport (particularly motor fuels and air transport) and clothing sectors. These were partially offset by an upward contribution from furniture, household equipment and maintenance.
Analysis of the detailed numbers for each contributor to inflation shows that in the financial services sector the cost of financial services grew by 1 per cent in August after small declines earlier in the year. Household insurance costs fell sharply by 6.5 per cent and transport insurance costs were down by 0.3 per cent but health insurance was up by 9 per cent.
The main inflation measures were unchanged between July and August: CPIH grew by 2.5 per cent and RPIJ grew by 2.6 per cent.
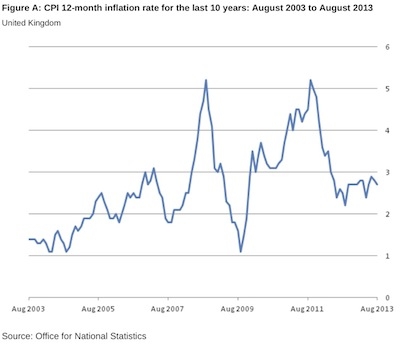
ONS says that the latest figures continue the trend of broadly steady inflation seen since spring 2012.
The CPI is a measure of consumer price inflation produced to international standards and in line with European regulations. First published in 1997 as the Harmonised Index of Consumer Prices (HICP), the CPI is the inflation measure used in the Government's target for inflation.
The CPI is also used for purposes such as uprating pensions, wages and benefits and can aid in the understanding of inflation on family budgets.
The CPI 12-month rate (the amount prices change over a year) between August 2012 and August 2013 stood at 2.7 per cent. This means that a basket of goods and services that cost £100.00 in August 2012 would have cost £102.70 in August 2013. The 12-month rate continues the trend seen since spring 2012 of broadly steady growth in inflation.
Over the last five years, the three main contributors to the 12-month inflation rate have been food & non-alcoholic beverages; housing, water, electricity, gas and other fuels; and transport (including motor fuels). Combined, these three sectors have, on average, accounted for over half of the 12-month inflation rate each month.
Figure A above shows the CPI 12-month rate over the last 10 years.
This page is available to subscribers. Click here to sign in or get access.