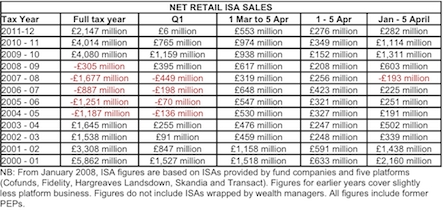
Key findings:
• ISA net sales at half the level of the previous two years
• Quarter 1 was the best quarter for fixed income funds since Quarter 3 2010
• £ Strategic bond the best-selling sector by far
Richard Saunders, chief executive of the Investment Management Association, said: "Investor appetite picked up in quarter 1 which saw stronger inflows than during the second half of 2011. ISA sales in the last tax year were a reasonably healthy £2.1 billion, though well down on the levels of the previous two years.
"In March fixed income funds continued to see the strongest inflows from retail investors, who continue not to add significantly to their overall holdings of equities. Both reflect a trend which has been apparent since last summer."
Net ISA sales were £553 million between 1 March and 5 April this year – well down on last year's £974 million. This continued the lower trend of ISA sales in recent months. The sales in March took the net sales total for tax year 2011/12 to £2.1 billion, down from the £4 billion in the previous two tax years, but still much higher than from 2004/05 to 2008/09. ISAs made up 17% of all authorised funds under management in March.
March saw net retail sales of £1.4 billion, in line both with the monthly average for the previous 12 months. Quarter 1 2012 net retail sales of £3.8 billion were significantly lower than the previous two years, each of which saw net retail sales of over £6 billion in their first quarters. Funds under management in March totalled £613.2 billion, slightly down on February. Funds under management for ISAs totalled £107.3 billion in March 2012, also slightly down on February.
Fixed income was the leading asset class for the seventh consecutive month with net retail sales of £660 million in March. The average monthly sales of fixed income funds over the last 12 months was £465 million. Quarter 1 was the best quarter for fixed income funds since quarter 3 2010. Mixed asset was the second highest selling asset class in March at £348 million. Net sales of equity funds were just positive at £17 million, lower than January and February but better than the second half of last year when sales were negative.
The £ Strategic Bond was the best selling IMA Sector by far in March, with net retail sales of £366 million, well above the monthly average for the previous 12 months of £211 million and the highest sales since April 2011. Mixed-investment 20 – 60% shares was the second most popular IMA Sector in March with £232 million in net retail sales, closely followed in third place by the £ Corporate Bond sector with net retail sales of £219 million. The best selling sector for ISA sales in March was £Strategic Bond, with net sales of £53 million. The second best selling sector was Global Emerging Markets with net sales of £35.5 million and the third best selling sector was Mixed Investment 20 – 60% shares with net sales of £35 million.
Gross retail sales through fund platforms* totalled £5.0 billion for March, a market share of 47% compared with 40% in March last year. Gross retail sales through Other intermediaries - which includes Wealth Managers and Stockbrokers - totalled £4.6 billion for March, representing 44% market share, slightly down from 45% in the same month last year. Direct channels' gross retail sales totalled £1.0 billion in March, with 9% of total sales. Funds under management for Fund Platforms**were £118 billion in March 2012. Gross sales of £3.9 billion were the highest since reporting began in January 2008. As usual at the end of the tax year, ISAs took a higher share of fund sales in March (28%) compared with recent months, though this was down on the 31% of March 2011.
NB: From January 2008, ISA figures are based on ISAs provided by fund companies and five platforms (Cofunds, Fidelity, Hargreaves Landsdown, Skandia and Transact). Figures for earlier years cover slightly less platform business. Figures do not include ISAs wrapped by wealth managers. All figures include former PEPs.

