Tuesday, 11 December 2012 10:12
Migration fuelling growth in England and Wales population - ONS
Migration over the past 10 years has significantly fuelled the growth of the population of England and Wales, according to the Office for National Statistics.
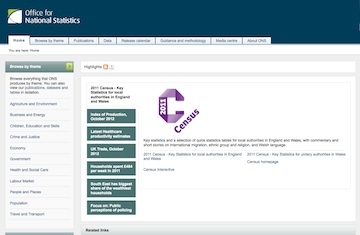
The ONS released detailed population data today from the 2011 Census which reveals the changing nature
of the population of England and Wales. The data shows that migration has helped fuel population growth but that other changes have also occured in the UK population.
The data supplements the figures published in July 2012, which put the total population of England and Wales on census day (27 March 2011) at 56.1 million – an increase of 3.7 million (7 per cent) since 2001 with 55 per cent (2.1 million) of this increase being due to migration.. The total UK population - including Scotland and Northern Ireland - is now estimated by many experts to be over 62.2m.
This data from the ONS details the characteristics of residents in 348 local authorities across England
and Wales, covering topics such as ethnicity, religion, country of birth,
health and accommodation. Full details are given in the latest ONS Statistical Bulletin and accompanying tables.
According to the ONS, some headline facts of life in England and Wales are:
Ethnicity
· Most residents of England and Wales belonged to the 'White' ethnic
group (48.2 million, 86 per cent); this is a 5 percentage point
decrease since 2001
· There were 2 million households in England and Wales where partners
or other household members were of different ethnic groups, 47 per
cent more than in 2001
Religion
· The number of residents who recorded their religion as 'Christian' in
2011 was 4m lower than in 2001
· Their numbers fell to 33.2 million (59 per cent) in 2011 from 37.3
million (72 per cent) in 2001.
· People who said they had 'No religion' rose by more than six million
to 14.1 million, almost double that of 2001
Country of birth
· Of the 7.5 million people in England and Wales on 27 March 2011 who
were born outside the UK, just over half arrived in the last 10
years.
Passports held
· 4.8 million residents of England and Wales held a non-UK passport
· Of these, 2.3 million were other EU passports, and 2.4 million were
other foreign passports
Health
· Four out of every five (81 per cent) of residents in England and
Wales described themselves as being in 'Good' or 'Very good' health
· 5.8 million (10 per cent) provided unpaid care for someone with an
illness or disability
· More than 2m of these people were giving 20 or more hours of
care a week
Tenure
· Since the 2001 Census the proportion of households owning their home
through a mortgage or loan has decreased from 39 per cent to 33 per
cent.
· The proportion owning their homes outright has increased from 29 per
cent to 31 per cent, and the proportion who are privately renting has
increased by 6 percentage points from 9 to 15 per cent
Cars and vans
· The number of cars and vans owned across households in England and
Wales increased by 3.4 million to 27.3 million between 2001 and 2011
(a 14 per cent increase)
{desktop}{/desktop}{mobile}{/mobile}
Findings around the regions include:
· In the North East more than two-thirds of the population said they
were 'Christians': 68 per cent – the highest percentage of all
regions
· Wales had the highest percentage of people stating they have 'No
religion' (32 per cent). Among England's regions the highest
percentage was found in the South West (29 per cent)
· In London 3.7 million residents, comprising 45 per cent of the city's
8.2 million residents, said they were 'White: British'. This is down
from 4.3 million, 60 per cent of residents in 2001 London had the
highest percentage of 16-to-64-year-olds (62 per cent) who said their
daily activities were not limited by illness
· Wales had the highest proportion of residents reporting that their
day-to-day activities were limited a little or a lot by a long term
health problem or disability (23 per cent) than any English region
· The West Midlands had the highest percentage in England of residents
who said they had no recognised qualification (27 per cent)
Guy Goodwin, ONS's director of Census, said: "These statistics paint a picture of society and help us all plan for the future using accurate information at a local level."
The number of foreign-born residents living in England and Wales increased
from 4.6 million in 2001 to 7.5 million in 2011 – 13 per cent of the
population. Of these 7.5 million, half arrived between 2001 and 2011.
The top five countries of birth are: India, Poland, Pakistan, Ireland and
Germany. Poland was not one of the 10 most commonly stated countries of
birth in 2001.
Ethnicity and identity
People describing themselves as 'White: British' have declined by 0.4
million since 2001. They made up 80 per cent of the population, compared
with 87 per cent in 2001. The largest increase in ethnic group between 2001 and 2011 was in the
'White: Other' category, which increased by 1.1 million to 2.5 million
usual residents in England and Wales. This reflects more than half a
million Poles who migrated into England and Wales between 2001 and 2011.
Religion
Religion was the only voluntary question in the 2011 Census. Residents
could choose between tick box responses of: Christian (all denominations),
Buddhist, Hindu, Jewish, Muslim, Sikh, No religion; or they could write in
any other religion.
· The most popular religion recorded was Christian, as in 2001
· The second most common religion was Muslim, with 2.7 million people
(4.8 per cent), an increase of 1.8 percentage points since 2001
· In Wales, nearly two-thirds (32 per cent) of the population stated
they have 'No religion' – the highest of all regions in England and
Wales
For further information visit: www.ons.gov.uk/census
This page is available to subscribers. Click here to sign in or get access.
Published in
Articles